

The Belgian Study Blueprint - What Actually Predicts Wins
How machine learning identified the 13 factors that separate winning from losing in professional football—and why most performance analysis is looking at the wrong things

Wrote this on Friday 6th February 2026 before the fixtures on Saturday 7th 2026, so there are likely to be some changes to the below (league places).
Football analytics is drowning in data but starving for insight.
Every week, post-match reports cite possession percentages, pass completion rates, expected goals, and distance covered. Pundits treat these as evidence of dominance. Clubs build recruitment strategies around players who tick certain statistical boxes. But here’s the problem: most of these numbers don’t actually predict whether you’ll win or lose.
A 2021 study from Belgian researchers at Ghent University cut through the noise. They fed 100 different variables into a machine learning model—shots, passes, physical output, squad values, everything—and asked one question: which of these actually matter?
The answer was brutal. Of those 100 variables, only 13 survived. The model correctly predicted match outcomes with 89.6% accuracy using just those 13 factors.
Expected goals (xG)? Not among them. (lol - might regretting the name of this blog, but xG still has value for measuring chance creation, even if it doesn’t predict winning as reliably as execution does.)
Total possession? Eliminated.
Pass completion rate? Irrelevant.
This matters for recruitment. If you’re scouting players based on metrics that don’t correlate with winning, you’re building on sand.
The Study: What They Actually Did
The researchers analyzed 576 matches from the Belgian Pro League across three seasons (2017-2020), excluding draws and incomplete data.
They started with 100 variables:
Shot metrics (location, target status, xG)
Technical actions (passes by direction/destination, dribbles, touches)
Physical output (distance by speed zone, accelerations, decelerations—split by half)
Tactical patterns (possession in different playing styles)
Set pieces (corners, free kicks, penalties)
Contextual factors (squad market values, team strength ratings, home/away, fixture congestion)
Using machine learning to test which variables actually predicted outcomes, they narrowed 100 down to just 13. Those 13 correctly predicted 516 out of 576 games—89.6% accuracy.
A caveat: This is Belgian top-flight data from 2017-2020, not the English Championship in 2025. Tactical trends evolve, league styles differ, and the physical intensity of the Championship may emphasize different attributes. But the fundamentals identified—where you shoot from, maintaining intensity, squad depth, tactical efficiency—are likely to translate across professional football.
The value isn’t in treating these 13 factors as gospel, but using them as a strategic framework to test against Championship-specific data. Which is exactly what this analysis does.
The Findings: Four Tiers of What Matters
Tier 1: The Non-Negotiable
Shots on target from the attacking penalty box - the overwhelming number one predictor.
Not total shots. Not shots from anywhere. Not expected goals. Specifically: shots on target originating from inside the 18-yard box.
This captures three elements simultaneously:
Territorial dominance (you got into the danger zone)
Quality of chance (box shots convert far more frequently)
Execution (you hit the target)
For recruitment: you want players who get into the box in shooting positions or create those situations for teammates. Volume shooting from distance is noise. Quality opportunities in the box is signal.
Tier 2: Physical Sustainability
Three of the top five predictors were physical metrics—all from the second half:
Number of accelerations >2 m/s²
Number of runs >15 km/h
Distance covered >25 km/h
First-half physical output? Not among the 13 predictors.
Winning teams don’t necessarily work harder overall—they maintain intensity when it matters most. As opponents tire and spaces open, the team that can still accelerate and hit top speed in the final 30 minutes has a decisive advantage.
The counterintuitive finding: runs >15 km/h was negatively associated with winning. More running often meant worse performance.
Why? Losing teams make desperate, reactive runs—chasing the game, covering defensive breakdowns, pressing frantically. Winning teams make opponents do the running while controlling space efficiently.
The lesson: you don’t want players who just cover ground. You want players who execute high-intensity efforts repeatedly in the second half in the right contexts—penetrating runs, recovery sprints when needed, explosive accelerations to create separation.
Tier 3: Squad Depth and Context
Bench current estimated total transfer value ranked third.
Squad depth quality matters. The ability to change games with substitutions, rotate without quality drop-off, and manage injuries becomes decisive. In a dataset where 52% of games were decided by one goal, fresh quality legs exploiting tiring opponents provides tangible advantage.
ELO rating (fifth) represents team strength—continuously updated based on results against varying opposition. Better teams win more. It validates the model’s logic: sustainable success requires addressing underlying quality gaps, not just tactical tweaks.
Home/away ranked eighth—relevant but not dominant.
Tier 4: Tactical Efficiency
The remaining predictors:
Number of direct play possession phases
Number of counter-attack possession phases
Number of possessions won
Distance 6-15 km/h (second half)
Number of crosses - negatively associated with winning
Teams that cross more tend to lose more. Crossing is what teams resort to when they can’t create better chances—a marker of attacking limitation (Blues are 2nd in League for crossing by the way).
The more successful approach: direct vertical play when space allows, quick transitions, winning the ball back aggressively, penetrating through or around defenses.
What Got Left Behind
Metrics that didn’t survive:
Total possession percentage
Total number of passes
Pass completion rate
Expected Goals (xG)
Distance covered in the first half
Most set-piece metrics
These aren’t useless—they provide context. But they don’t predict outcomes as reliably as the 13 that remained.
Dominating possession but losing? Possession alone doesn’t drive results—getting shots on target from the box does. Completing 85% of passes? Irrelevant if those passes don’t progress you into dangerous areas. Leading the xG count? Meaningless if you can’t execute when it matters.
The Championship Test: Does the Belgian Study Hold?
The Belgian study identified principles. Championship data tests whether they translate.
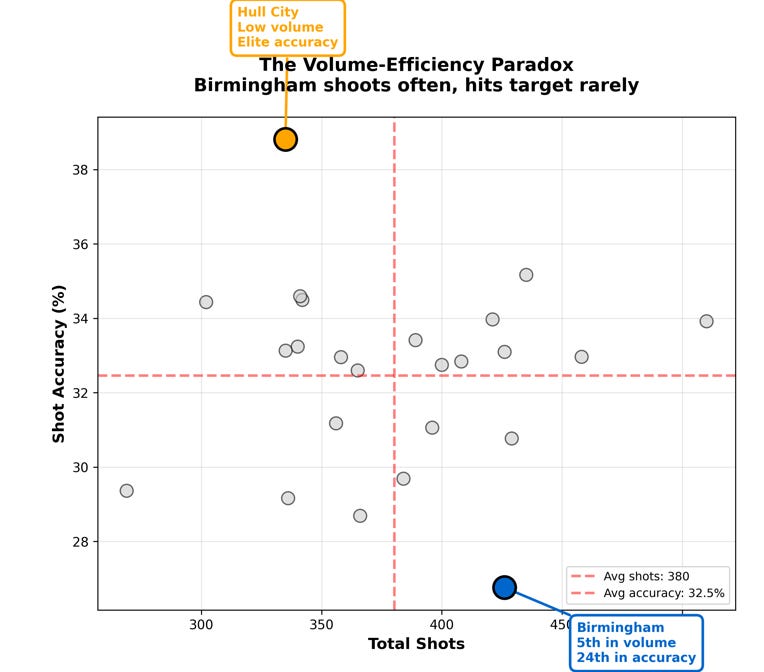
Two teams provide the perfect case study: Hull City and Birmingham City. They sit 20 positions apart in the xPoints table despite nearly identical expected points positions—in opposite directions.
Critical Data Caveat
Important limitation: The Championship data presented here tracks total shots on target, not specifically shots on target from the penalty box, which is what the Belgian study identified as most predictive.
Without granular shot location data, I can’t separate:
Box shots on target (high value, Belgian study’s #1 predictor)
Distance shots on target (lower value, but still “on target”)
This means some teams may be inflating their “shots on target” numbers with low-threat efforts from 25 yards that technically hit the target. Conversely, teams with lower overall accuracy might excel specifically at getting box shots on target while missing from distance.
The core thesis remains valid—shot accuracy and execution matter enormously—but the Belgian study’s most predictive variable is narrower than what Championship-level data currently captures. I’m measuring directional accuracy while acknowledging we’re working with a slightly broader category than the study’s precise metric.
With that context established, here’s what the Championship data reveals.
The Hull City Phenomenon
Hull City sit 3rd in the actual Championship table with 54 points from 30 games.
Their expected points position? 22nd out of 24 teams.
They’re overperforming their expected position by 19 places—the biggest overperformance in the entire division. By expected points logic—comparing their match-by-match xG battles against opponents—they should be fighting relegation. Instead, they’re in automatic promotion contention.
How?
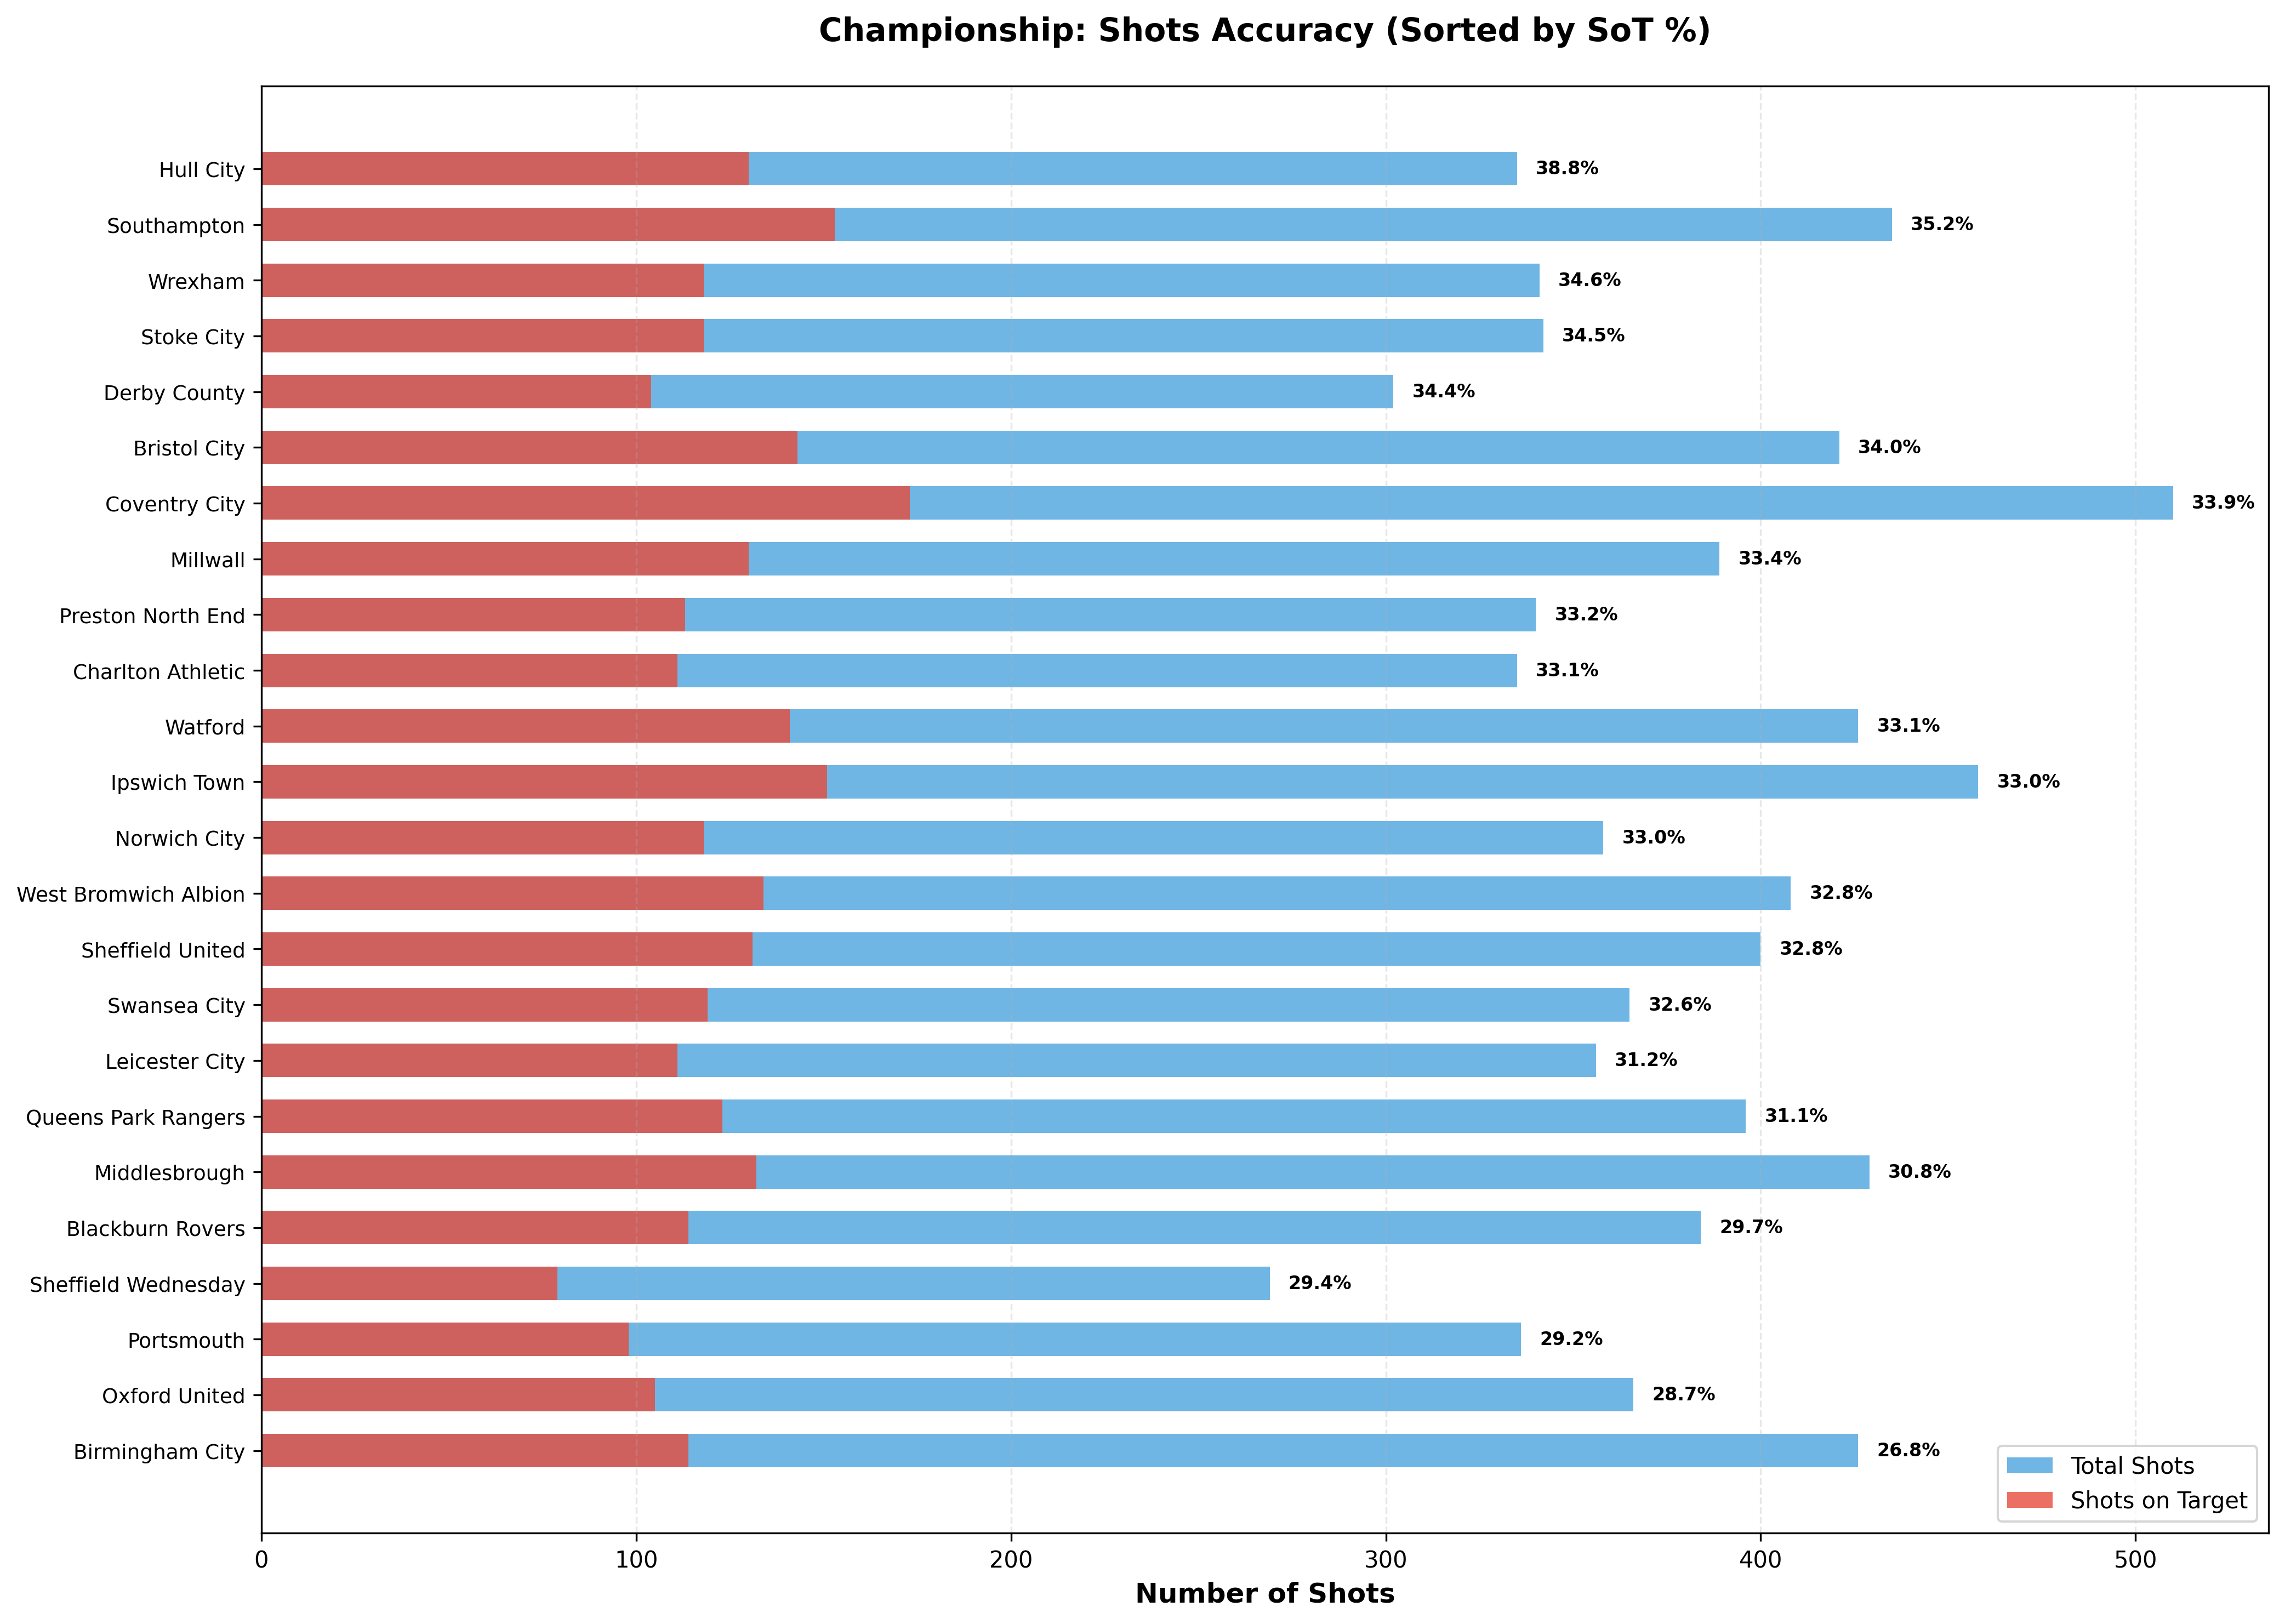
Shot accuracy: 38.81% (1st in Championship)
Hull don’t consistently “win” the xG battle in matches. Their expected points total (34) suggests they’re regularly being out-chanced by opponents. They take fewer shots than most teams (335 total, among the lowest). But when they shoot, they hit the target at a rate nearly 12 percentage points higher than the Championship average.
Under Sergej Jakirović, Hull emphasize defensive solidity and clinical transitions. They don’t dominate possession or territory—they defend compactly, win the ball back, and exploit space efficiently when it appears.
The takeaway: Hull have optimized shot selection and execution over volume creation. They’re the Championship’s living embodiment of the Belgian study’s findings—prioritizing the metric that predicts winning (shots on target) while accepting they’ll “lose” on advanced metrics (xG, possession) that don’t correlate with actual results.
The Birmingham Paradox
Birmingham City present the inverse case study—and it’s far more complex than simple underperformance.
In previous articles, I’ve highlighted that Blues sit 3rd in the Championship Expected Points table. This metric compares each team’s xG against their opponents’ xG on a match-by-match basis—if Blues finish with 1.43 xG vs an opponent’s 1.30 xG, they’re awarded the 3 expected points for “winning” that xG battle. Totaled across the season, Birmingham’s expected points (51) suggest they should be 3rd in the division.
Surface-level analysis suggests they’re consistently out-chancing opponents and should be significantly higher than their actual 13th-place position.
But the Belgian study suggests xG isn’t the metric that matters most. And when you examine Blues through the lens of what does predict winning, the story changes dramatically.
Expected Points Position: 3rd (51 points)
Actual Position: 13th (42 points)
Underperformance: 10 positions, 9 points
The headline number that explains everything:
Shot accuracy: 26.76% (24th in Championship - dead last)
Blues aren’t just creating chances in isolation—they’re winning the match-by-match xG battle consistently enough to rank 3rd in expected points. But they’re failing the Belgian study’s #1 test: execution.
The Volume Problem
Total shots: 426 (5th in Championship)
Shots on target: 114 (16th in Championship)
Shot accuracy: 26.76% (24th - worst in division)
Blues generate shots at an elite rate. The problem is what happens when they shoot.
The Efficiency Gap
League average shot accuracy: 32.46%
Birmingham’s accuracy: 26.76%
Gap: -5.70 percentage points
That’s more than two standard deviations below the Championship average. To contextualize:
If Blues matched Hull’s efficiency (38.81%) with their current shot volume, they’d have 165 shots on target instead of 114—a 51-shot difference in the Belgian study’s #1 predictor. If Blues even reached league-average efficiency (32.46%), they’d have 138 shots on target—24 additional shots testing opposition keepers.
The Home/Away Catastrophe
The efficiency problem becomes even more pronounced when split by venue:
Home shots on target: 5.36 per game (4th in Championship)
Away shots on target: 2.38 per game (24th - worst in division)
Drop-off: 55.6%
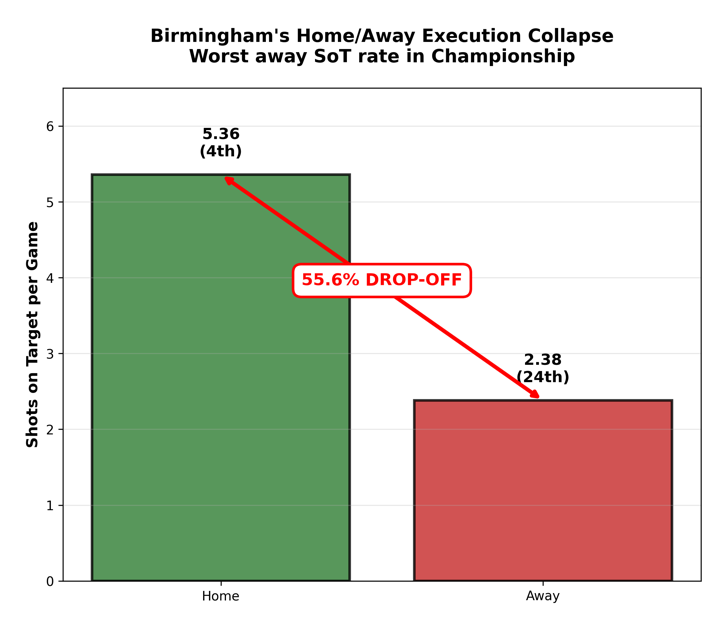
This isn’t normal home advantage. The Belgian study ranked home/away as 8th of 13 predictors—meaningful but not dominant. Research during COVID’s empty-stadium periods found that home advantage fell by about a third without spectators but notably persisted even in empty grounds, suggesting crowd support is only part of the equation. Other factors—pitch familiarity, travel fatigue, tactical setup—continue to matter.
If typical home advantage in professional football provides a 10-30% boost to performance, Birmingham’s 55.6% variance is well beyond what home advantage alone explains. The same players who generate elite shot output at St. Andrew’s (4th-best in the division) produce the worst away record for getting efforts on target.
This extreme split points toward addressable factors rather than inevitable home advantage or fundamental personnel gaps.
Possible explanations (acknowledging these are hypotheses requiring deeper investigation):
Tactical approach differs: More conservative setup away, reducing attacking personnel or intent in advanced positions
Psychological factors: Confidence or pressure affecting execution quality beyond normal home advantage
Opposition response: Teams pressing Blues more effectively away, disrupting build-up and shot creation
Shot selection: Taking lower-quality efforts away (desperation or caution) rather than inability to create opportunities
The capability exists—Blues prove it at home. What changes away becomes the key question worth investigating.
The 20-Position Swing: When Execution Trumps Creation
Hull City and Birmingham City represent a 20-position gap in the Championship table (3rd vs 13th) with a 19-position expected points difference in the opposite direction (22nd vs 3rd).
Hull City:
Actual position: 3rd
Expected points position: 22nd
Overperformance: +19 places
Birmingham City:
Actual position: 13th
Expected points position: 3rd
Underperformance: -10 places
The variable separating them?
Shot accuracy differential: 12.05 percentage points
Hull’s efficiency: 38.81%
Birmingham’s efficiency: 26.76%
Hull rarely “win” matches on xG—their match-by-match xG battles suggest they should be 22nd. But they execute so efficiently that they convert low-xG performances into actual points.
Blues consistently “win” matches on xG—their match-by-match dominance suggests they should be 3rd. But they execute so poorly that they convert xG superiority into dropped points.
One team has optimized the metric that predicts winning. The other has optimized a metric that the machine learning model eliminated.
This isn’t theoretical. This is a 20-position table gap explained by execution vs. creation—by whether teams prioritize the Belgian study’s #1 predictor or advanced metrics that don’t correlate with results.
Crossing Volume
Birmingham’s crossing numbers provide additional context:
660 total crosses (2nd in Championship)
Belgian study finding: Crossing negatively associated with winning
Blues cross more than almost any team in the league while struggling to get shots on target—particularly away from home where they rank dead last.
Championship-wide data reveals the volume-efficiency paradox:
High-volume shooting teams (400+ shots): Average 32.47% accuracy
Low-volume shooting teams (<350 shots): Average 33.41% accuracy
More shots doesn’t correlate with better accuracy. Quality beats quantity. The Belgian study’s hierarchy reinforces this: get into the box, create genuine chances, hit the target.
In January 2026, Blues signed Carlos Vicente from Deportivo Alavés for approximately £7 million. Vicente is a traditional touchline winger who ranked 98th percentile in La Liga for successful crosses per 90. Blues have invested significant money in a player whose primary function is the exact tactical pattern the Belgian study identified as negatively correlated with winning.
Whether this represents tactical mismatch or execution theory—adding better box presence (like January signing August Priske) to improve conversion on crossed chances—will be explored in the upcoming Crossing Fallacy piece, alongside which Championship players offer more efficient attacking alternatives.
The Recruitment Implications
1. Attack the Box, Not the Byline
Scout players who:
Register high volumes of shots from inside the penalty area
Arrive in the box at the right moments
Create box entries through penetrating passes or dribbles
Avoid over-valuing players whose shots come from low-percentage areas or whose chance creation doesn’t translate to quality opportunities.
2. Prioritize Second-Half Athletes
Physical profiling should emphasize:
Repeated sprint ability
Acceleration capacity maintained late in matches
Recovery between high-intensity efforts
Do players’ outputs drop significantly after 60 minutes? That’s a red flag.
3. Don’t Neglect Squad Depth
Bench quality directly correlates with winning. Don’t obsess over the starting XI then fill the bench with cheap squad fillers. Ensure your 16-18 core squad members are all genuinely competitive quality.
4. Value Execution Over Creation
Expected points tells you who’s creating enough quality chances to win matches on paper. Shot accuracy tells you who’s doing something productive when those chances arrive.
Hull City generate poor expected points but execute at an elite level. Blues generate elite expected points but execute at a relegation level.
The Belgian study suggests execution matters more.
Identify players who create quality chances, make intelligent runs, progress the ball vertically, and recognize transition moments. But also—critically—identify players who can finish those chances when they arrive.
Avoid players whose work involves excessive crossing, low-percentage shooting from distance, or horizontal passing that doesn’t advance play.
What’s Coming Next
Over the next few weeks, I’ll be applying the Belgian study’s findings to Championship football and recruitment analysis, using Blues as a reference point:
The Penalty Box Problem - What shots on target from the box actually looks like in practice, which Championship #10s excel at getting quality efforts away in dangerous areas, and what player profiles generate this output consistently. Plus: granular shot location analysis to separate genuine box threats from distance shooters.
The Crossing Fallacy - Why crossing correlates negatively with winning, what more efficient attacking patterns look like, which Championship players offer alternative progression methods, and why Birmingham’s 2nd-place crossing volume is a symptom, not a solution.
Second-Half Breakdown - How to profile players for sustained physical intensity, what second-half performance data reveals about Championship squads, and which players maintain output late in matches when games are decided.
Why Squad Depth Decides Tight Margins - How bench quality impacts results, depth analysis across the Championship, and what this means for recruitment strategy beyond the starting XI.
Each piece will include specific player profiles and scouting reports—applying the Belgian blueprint to identify targets who address these priorities.
The Bigger Picture
The Belgian study provides an evidence-based hierarchy of what drives results in professional football, separating signal from noise.
Championship data validates the core findings: Hull City are 19 positions above their expected points position by optimizing shot accuracy. Blues are 10 positions below their expected points position despite consistently winning match-by-match xG battles.
The distinction matters: Birmingham aren’t just generating high volumes of chances—they’re generating enough chances relative to opponents to “win” matches on xG models. Yet they’re losing those actual matches because they can’t execute in the moments that matter.
For analysts: a framework for evaluating what to measure and what to ignore.
For recruiters: a blueprint for which player attributes translate to winning matches.
For clubs: a reminder that sustainable success comes from getting fundamentals right—create quality chances in the box, maintain intensity throughout matches, build genuine squad depth, execute with tactical intelligence.
Teams that align recruitment, training, and tactics to these principles will systematically outperform those chasing metrics that don’t predict outcomes.
The data is clear. The question is whether clubs are willing to listen—and whether they’re measuring the right things in the first place.
This is the first in a series examining what actually predicts winning in professional football and how to apply these findings to recruitment analysis in the Championship.
Probably your finest piece yet, wonderful dive into explaining our xPts discrepancy. I wonder how xGOT would stack up in those rankings, as it seems a best of both statistic.